
Dashboard
The Dashboard is the first screen you see when you open the admin panel (the sidebar item is labeled Home). It summarizes the health of the organization in a few numbers and shows which agents are being used the most.
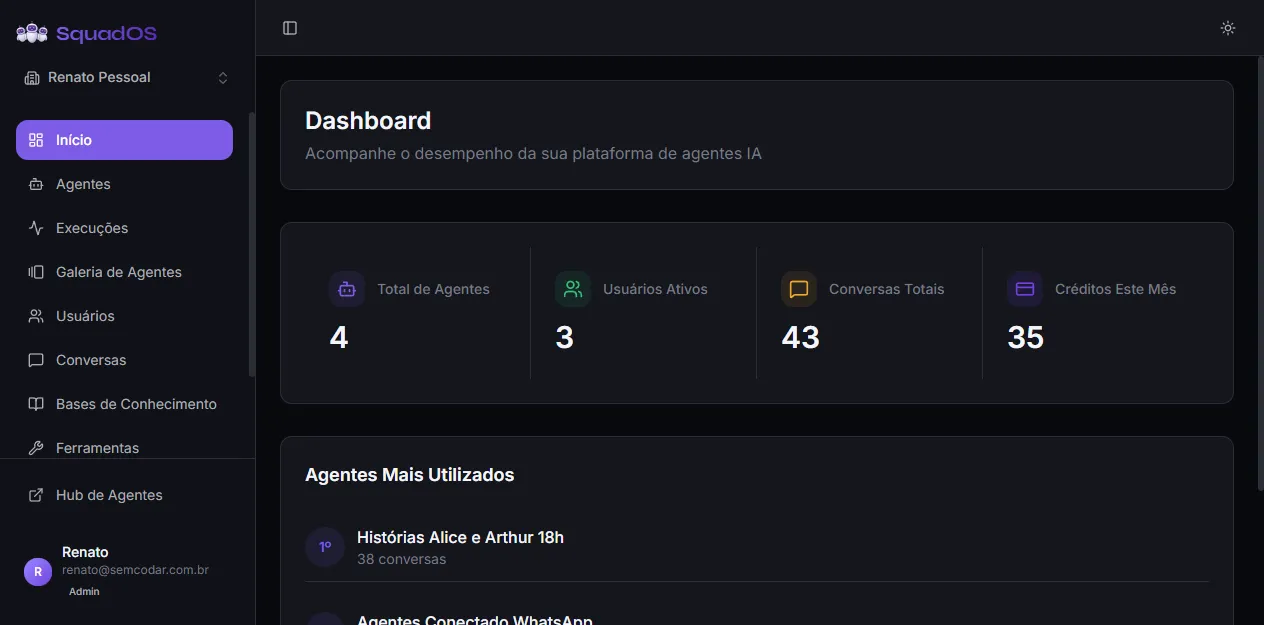
Main metrics
Section titled “Main metrics”Four indicators appear at the top:
- Total Agents: how many agents exist in the organization (active and inactive both count).
- Active Users: how many people have access to the organization.
- Total Conversations: sum of all conversations ever held with agents in the organization.
- Credits This Month: credits consumed during the current month.
Values are aggregated per organization. If you switch organizations using the sidebar selector, the Dashboard recalculates everything automatically.
Most Used Agents
Section titled “Most Used Agents”Below the metric cards you see a ranking of the agents that received the most conversations, with position (1st, 2nd, 3rd…) and conversation count. This block shows where real usage is:
- agents at the top deserve more care in prompt, model, and tool review;
- agents that never appear may be poorly promoted, misconfigured, or already irrelevant.
If the organization has not held any conversations yet, the block shows “No conversations yet” instead of a list.
How to use it day to day
Section titled “How to use it day to day”- Check the Dashboard after publishing a new agent to confirm it is being used.
- Use the monthly credit consumption to decide whether to review models or history limits before changing plans.
- When the number of conversations grows quickly, open Analytics to investigate cost, latency, and errors per agent.