
Analytics
The Analytics page brings together everything admins need to understand how their organization is using SquadOS — conversation volume, credit consumption, most-used models, and audit trail.
Available tabs
Section titled “Available tabs”The page has six tabs at the top:
- Overview: summary cards + daily conversations chart (last 30 days).
- Agents: top 10 agents by conversation count, with a link to drill into each agent’s detail.
- Users: most active users (conversations and credits consumed).
- Models: usage breakdown per LLM (donut + bar + tokens/credits table).
- Credits: filterable consumption analysis by period, channel, and agent.
- Logs: audit trail (admins only).
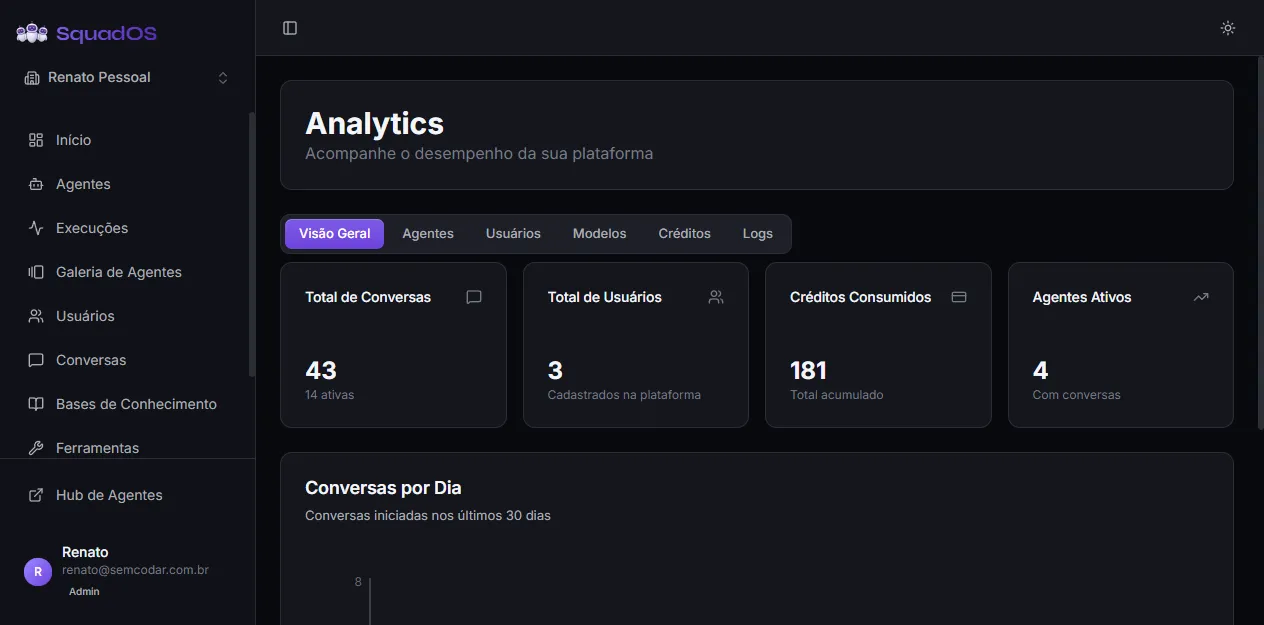
Overview
Section titled “Overview”The four cards show, for the last 30 days:
- Total Conversations (with active count);
- Total Users registered on the platform;
- Credits Consumed (cumulative);
- Active Agents (those with at least one conversation).
Below the cards, the Conversations per Day chart shows daily evolution. If there are no conversations in the period, the chart area shows an empty-state message.
Agents
Section titled “Agents”Lists the top 10 agents by conversation count. Each row has a bar indicator proportional to the most-used agent and a View Details button that opens that agent’s individual analytics (/admin/analytics/agents/:id). Archived agents show an Archived badge next to the name.
Shows the organization’s most active users, with name, email, total conversations, and credits consumed per user.
Models
Section titled “Models”Three cards at the top: Total Messages, Models Used, and Most Used Model.
Below, two side-by-side charts:
- Distribution by Model (donut chart) with usage proportion per model;
- Usage by Model (horizontal bars) with messages per model.
Last, a detailed table with Model, Messages, Tokens (in / out), Credits, and Credits per Message.
Credits
Section titled “Credits”The densest tab. It has four filters at the top (Agent, Channel, Start Date, End Date) that apply to everything else on the tab. The filters come pre-set to the last 30 days.
Then you get:
- Three summary cards: Total Credits, Total Messages, and Average per Day;
- Usage per Day chart with two series (messages + credits) on separate axes;
- Top Agents by Consumption table with main channel, messages, and credits per agent.
Audit trail with sensitive organization events (changes to agents, tools, users, billing). Only visible to users with the Admin role (or higher).
How to use it day to day
Section titled “How to use it day to day”- Start on Overview to get a pulse of platform volume.
- If Credits Consumed is growing faster than expected, open the Credits tab and filter by agent to find where the spend is coming from.
- On the Models tab, agents using an expensive model for simple tasks are the first candidates for a model switch.
- Use the Logs tab to review recent changes when something “stopped working” without a clear cause.